
Showing posts with label Retail. Show all posts
Retailers using pent-up cash; 58% plan to increase capital spending, with IT No. 1 priority
While waiting for the recovery to take the hold, 58% plan to increase capital spending over the next year. The highest priority investment area is information technology – including data analytics and digital marketing channels – cited by 51% of the executives in the KPMG survey. Other significant areas of investment for retailers are new products or services (43%), geographic expansion (33%), and advertising and marketing (24%).
When asked about digital marketing channels, retail executives in the 2012 KPMG retail survey indicate that online shopping (59%), social media platforms (58%), and email campaigns (49%) are having the most significant impact on their businesses. Additionally, executive indicate that the incorporation of mobile technology is also having a significant impact, specifically mobile shopping (36%), mobile promotions (28%), and mobile payments (21%).
Executives also say that the use of data analytics is playing a larger role in their strategic decision making – including areas such as customer insight, brand and product management, pricing decisions and market expansion.
Why Loyalty Programs Can Be Bad for Business
In my work with companies on pricing strategies, it's common for executives to feel compelled to offer loyal customers something for free. My immediate question is: "Why?" Giving something away for free as a gesture of thanks has become almost reflexive in business. But when you examine the strategic value and underlying costs of these programs, I've found that loyalty discounts are rarely necessary to close a deal, nor are they always highly valued by customers.
Why Sephora Is Betting Big on Digital Shopping
Sephora is one of the brands that’s leading the way in shaping digital experiences for its customers. The company recently invested in an entirely new shopping experience that integrates mobile, social and in-store activity. On this episode of Revolution, Julie Bornstein, SVP Digital at Sephora, shares with us the importance of delivering a holistic digital and “IRL” experience, while also enhancing the individual path each customer takes to engage with the brand and their favorite products.
Brazilian fashion retailer displays Facebook ‘likes’ for items in its real-world stores
Through its new “Fashion Like” initiative, C&A has posted photos of a number of the clothing items it sells on a dedicated Facebook page, where it invites customers to “like” the ones that appeal to them. Special hooks on the racks in its bricks-and-mortar store, meanwhile, can then display those votes in real time, giving in-store shoppers a clear indication of each item’s online popularity. The video below (in Portuguese) outlines the premise in more detail:

Home Depot Rolls Out New Mobile Devices for Workers
Home Depot has started to roll out a scaled down, second generation mobile device for its sales associates, allowing more workers to use wireless technology to assist customers, CIO Matt Carey told CIO Journal. The 25,000 device roll-out is intended to make it possible for more store workers to help customers locate items and give information on products, even in areas for which they don’t have specialized expertise. It’s also an example of how Home Depot is attempting to use technology to increase the amount customers spend on each trip to the store, as well as sales to new customers, an area of focus as the chain has slowed the opening of new stores.
The device, called First Phone Junior, is a scaled-down version of the Motorola phone the company put in the hands of some associates two years ago, which allowed employees to better manage inventory, assist customers and speed checkout lines.
While the long-predicted demise of the bricks-and-mortar store has been greatly exaggerated, there is no doubt that customers are migrating to digital channels in growing numbers. Accenture looks at the issues, and identifies three steps that retailers can take to rethink the way they attract, serve and retain customers, then allocate capital and resources accordingly.
IBM Survey Reveals Marketers Face Tech Dilemma in Reaching the Connected Consumer
IBM's new survey of the marketing industry finds that chief marketing officers (CMO) and chief information officers (CIO) must join forces in order to connect with today's consumer across new channels including mobile devices and social networks. Fully 60 percent of marketers point to their lack of alignment with the company's IT department as the biggest obstacle to reaching today's consumers.
Gone are the days when online shoppers would wait for 2 seconds for your website to load, now they will switch at the blink of an eye.
For Impatient Web Users, an Eye Blink Is Just Too Long to Wait
People will visit a Web site less often if it is slower than a close competitor by more than 250 milliseconds (a millisecond is a thousandth of a second).
“Two hundred fifty milliseconds, either slower or faster, is close to the magic number now for competitive advantage on the Web,” said Harry Shum, a computer scientist and speed specialist at Microsoft.
The performance of Web sites varies, and so do user expectations. A person will be more patient waiting for a video clip to load than for a search result. And Web sites constantly face trade-offs between visual richness and snappy response times. As entertainment and news sites, like The New York Times Web site, offer more video clips and interactive graphics, that can slow things down.
But speed matters in every context, research shows. Four out of five online users will click away if a video stalls while loading.
Dynamics and Science behind the long queues you see at the registers.
Much of the work grows from more nuanced understandings of how people perceive waiting in line. Shoppers tend to become impatient quickly and fail to take into account key indicators of what may slow down a line. They experience remorse when they feel they've chosen the wrong (i.e. slower) line. And they prefer to choose their own line rather than wait in a single-file line for the next available register—even though that set-up has proven to be faster, research on queuing shows.

Mindflash has released a great infographic which examines the world of seasonal employment, what other companies are doing and how you can successfully hire employees for your business.

Risks for Retailers: A New Top 10
Retailers are less worried about consumer spending these days, suggesting that their confidence level has risen from the doldrums, according to a recent review of regulatory filings by BDO USA.
The accounting firm found that concern over consumer confidence and spending has fallen out of retailers' 10 most-cited risks, from 5th in 2010 to 11th this year. But concern about the state of the economy still tops the list, as it has for the past two years. BDO ranked top risk factors after looking at the most recent 10-Ks of the 100 largest (by revenue) publicly traded retailers.

Willard Bishop’s latest Competitive Edge provides insight into some existing and potential ways retailers can maximize their store space to drive efficiency and differentiation and increase sales and shopper satisfaction.
My Store Is Too Big – What Do I Do With The Extra Space?
With the evolution of Supercenters, Dollar, Specialty, and Limited Assortment stores, grocery retailers have added space to accommodate a plethora of services, enhanced the perimeter of their stores, and increased assortment in order to drive differentiation and fend off competitive pressures. Unfortunately, despite these efforts, grocery’s overall market share (of dollars) has declined by 49% (1988 – 90% to 2010 – 41%). Based on these trends, retailers now have too much square footage to support their businesses and are unsure what to do with the excess space.
Interview of Chris Allan, Quantum Retail Technology’s Chief Strategy Officer with P.J. Jakovljevic in Technology Evaluation Centers where he talks about Quantum’s Q Platform, competitive landscape and what wakes them up at night.
Quantum Retail: Challenging the “Enterprise Apps Establishment” and Retailers’ Mindset – Part 2
PJ: What is your killer value proposition that other retail software “usual suspects” (e.g., Oracle, SAP, SAS, JDA, etc.) fail to provide? In other words, what are the pain points that only you can cure for your customers (and with what typical benefits)?
CA: The Q Platform (explained in Part 1) actually solves the problems that these other vendors mainly talk about solving–and delivers on the business case every time, with proven, measurable results. Quantum has developed the concept of managing by Merchandising Strategy–determining the role of the product within the customer offering, such as being an image item, loss leader, traffic driver, etc. (see Part 1 for more details).
Users are not asked to select from an overwhelming number of forecasting algorithms and replenishment algorithms, and to set a slew of tricky parameters up around each of those algorithms for every stock-keeping unit (SKU) in every store. Q takes the chosen Merchandising Strategy and understands the objectives of the product from both a financial and a merchandising perspective and ensures that every inventory decision that is made is aligned with achieving those objectives.
The way that customers buy product changes over time and Q adjusts automatically to react to those changes, ensuring that alignment is maintained throughout the products’ lifecycle. This is very different from having to actively maintain the ordering, allocation, and replenishment configurations for every SKU in every store and manually ensure that the system is set up correctly (which is the value prop of our aforementioned competitors).
In the process of understanding items Q considers over 30 dimensions of product behavior including average sales, maximum sales, demand, days between sales, lost sales, days between stock-outs, current inventory, last stock-out, weeks of supply, percent in stock, etc. Beyond these typical sales and inventory metrics, Q also understands the following:
- When the issues happened, e.g. an out-of-stock on Monday has different gravity than out-of-stock on Saturday
- Variations in contributing factors such as lead times, lifecycle, and customer service level
- Variability and uniqueness in sales such as volatility, lumpiness, lost sales, demand vs. sales
- Finally, and perhaps most importantly, profitability metrics such as gross margin return on inventory investment (GMROI)
These capabilities have led to retailers being able to have a high degree of automation with Q using exception management to highlight only those areas where users should be spending time in the system. Typical results achieved and verified (by Quantum’s customers that were mentioned in Part 1) are as follows:
- A 2.2 percent full-price sales increase (in fast fashion)
- A 5.6 percent sales increase (in general merchandise)
- A 4 percent increase in gross margin
- An 11 percent inventory reduction
- A 40 percent reduction in overstocks
Retail E-Commerce Spending up 27%, Thanks in part to Free Shipping
by Deepak Sharma on Sunday, December 19, 2010
There’s a 12% increase in retail e-commerce spending in the first first 47 days of the November – December 2010 holiday season compared with the same period a year ago.
comScore is reporting that for the holiday season-to-date, $27.46 billion has been spent online, marking a 12-percent increase versus the corresponding days last year. The most recent week (week ending Dec. 17) reached $5.15 billion in spending, an increase of 14 percent versus the corresponding week last year, with four individual days surpassing $900 million, led by Green Monday (Monday, December 13) with $954 million and Free Shipping Day (Friday, December 17) with $942 million. A lot of shopper took advantage of the Free Shipping Day which achieved a 61-percent increase versus the corresponding shopping day last year, highlighting the appeal and success of the promotion in which more than 1,500 merchants offered free shipping.
| 2010 Holiday Season To Date vs. Corresponding Days* in 2009 Non-Travel (Retail) Spending Excludes Auctions and Large Corporate Purchases Total U.S. – Home/Work/University Locations Source: comScore, Inc. | ||||
| Millions ($) | ||||
| 2009 | 2010 | Percent Change | ||
| November 1 – December 17 | $24,504 | $27,460 | 12% | |
| Thanksgiving Day (Nov. 25) | $318 | $407 | 28% | |
| Black Friday (Nov. 26) | $595 | $648 | 9% | |
| Cyber Monday (Nov. 29) | $887 | $1,028 | 16% | |
| Green Monday (Dec. 13) | $854 | $954 | 12% | |
| Free Shipping Day (Dec. 17) | $586 | $942 | 61% | |
| Week Ending Dec. 17 (Dec. 11-17) | $4,644 | $5,509 | 14% | |
That means Cyber Monday emerged as the season’s heaviest online spending day for the first time in history.
"Free Shipping Day punctuated an exceptional week in which consumers spent more than $5.5 billion online, representing a 14-percent increase from last year," said comScore chairman Gian Fulgoni. "While no individual days during the week surpassed $1 billion in spending, we saw strength throughout the week beginning with Green Monday and ending with Free Shipping Day on Friday. At this late juncture in the online holiday season, we have likely already witnessed the peak spending day of the year, which means that Cyber Monday should emerge as the season's heaviest online spending day for the first time in history."
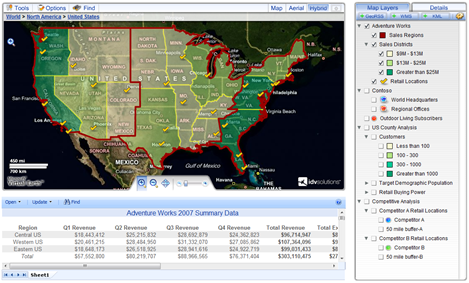
Check out this really cool Retail demo depicting Sales Dashboard on a Map. The color coding on the map and the ability to add details by using layers make it even more interesting. You can drag any asset from the map to the right side details tab and see even more finer details like picture of the store, product revenue etc. The demo utilizes Microsoft SharePoint Server, Virtual Earth and some nifty Flash animation.
If Store openings are any indication, retailers are surely looking forward to a better year and that recession is over. About.com maintains a complete and ongoing list of the store openings announced for 2010 by US Retailers. Good source to track the Retailers that are bullish on the market.
Just went through the great coverage of NRF’s recently concluded 99th Annual Convention & EXPO by NRF’s Stores Magazine. Good Read.
Indian Retailer Sales per Sq Ft comparable to US Retailers
by Deepak Sharma on Thursday, September 04, 2008
Interesting metrics related to Retail Sales per Square Feet coming out of on news article (Retail biggies force to focus on destination malls) I read yesterday. In India, the modern neighborhood format stores are achieving sales per square feet around Rs16-20 per sq ft per day. And a number of Rs 35-40 (roughly $1) is considered viable to keep running the store.
The thruput (sales) for the modern neighborhood formats currently stands at Rs 16-Rs 20 per sq ft per day as against Rs 35-Rs 40 per sq ft per day, which industry experts reckon is the minimum required for viability. There is a huge mismatch between the rents paid and the actual sales that take place in the formats.
This comes to be roughly $360 for the year which is very much comparable to that of Retailers in United States, which considers $300 per square feet as a respectable number (as of 2005).
As of 2005 annual store sales in the range of $300 per square foot ($3,000/m²) is considered a respectable result in the United States as the national average for regional malls is $341 per square foot[1], but the target number depends on the location, the type of store and other factors.
Just to corroborate this, I searched for Reliance Retail's (One of India's top Retailers) Sales per square feet and found this article, Reliance Fresh and Small. According to this article, Reliance Retail could be having Sales per sq ft north of $300.
Sources say that Reliance believes each Reliance Fresh outlet could earn annual revenues of Rs 3 crore. That’s a sale per sq. ft of roughly Rs 12,500. Industry sources say this is in line with what other chains have achieved in the past. For instance, at its peak FoodWorld had managed a Rs 300-crore turnover on its 80 stores. The average size of a store was about 3,000 sq. ft — or sales of Rs 12,500 per sq. ft.
Some more details on Sales per Square Foot for US Retailers:
Aberdeen Research: Lifetime Customer Value Identified as a Key Motivator for Customer Loyalty in Retail
by Deepak Sharma on Sunday, August 10, 2008
From http://www.aberdeen.com/press/releases/press_release.asp?rid=341
Aberdeen data reveals that the top business pressure impacting loyalty-related decisions of 58% of Best-in-Class companies in retail is the need to develop lifetime customer value, which is defined as the present value of future cash flows through long-term customer relationships.
“In times of stagnant growth, retailers need to develop lifetime customer value through improved customer retention, re-activation, and acquisition strategies. This will improve long-term stakeholder value and ensure an assured revenue stream for the retailer through customers who are expected to spend for several years,” says Sahir Anand, senior analyst and chief author of the customer loyalty benchmark report.
Aberdeen data reveals that 93% of retailers execute loyalty programs as a standard offering for their web, store, or catalog channel customers. Such campaigns include, but are not limited to, point perks, rewards, coalition marketing, frequent buyer offers, or private label credit cards. The reports also indicated that lifetime customer value in retail is being overshadowed by the tactical nature of loyalty campaigns that target short-term demand. “Loyalty campaigns are executed without due consideration to ideal customer segments, tools, coordinated cross-channel marketing needs, and long-term customer relationships,” says Anand.
The measurement of ROI on customer loyalty programs is a continuous action at retail headquarters. Moreover, determining such an ROI is a much simpler process compared to other retail solutions such as POS, merchandising or pricing. There are substantial and recurring cost factors associated with loyalty in retail. Survey results show that cost-benefit issues surrounding loyalty scenarios are top-of-mind for retail marketers. Repeat visit (61%), incremental sales (58%), and overall satisfaction (57%) have emerged as the three most significant factors used by retailers for justifying spend on loyalty elements, operational costs, and upgrade / deployment of loyalty software applications. All three ROI criteria can lead to sales uplift, retention improvement, and reduced attrition for retailers.
A very well written blog post on the relationship based on trust between Retailer and Vendors when it comes to shipping displays, running promotions and packaging.
Why would I stop a vendor from shipping displays, running promotions and changing packaging? Because I don’t trust that they know what they’re doing. I’ve seen too many hastily designed displays, too many promotions that build up like expired plaque on my planogram, and too much packaging that shows how little they understand the value of real estate. From here, it’s a short leap to understand why I’d ask for “just hand me the check book” entitlement programs. Entitlements are insurance policies against vendor marketing failures. Pay me up-front. I expect you to fail.
All this makes sense until a brand shows me that they understand what I do for a living and then proves it. Show me quantitative packaging and promotion research measured against your end users who shop in my stores. Show me how you’ll forecast it, ship it, sell it through, and then clean it up after it’s done. If you can do this, I’ll test anything you want because I’ll believe that you know what you’re doing and you won’t make a complete mess of the one thing I have that you don’t – my stores.
http://note-to-cmo.blogspot.com/2008/07/yin-and-yang-of-retail.html
 Multiple Food retail and wholesale operators gathered at the recently conducted The FMI Show plus MARKETECHNICS and got to see the latest consumer product trends and explore strategies for satisfying customers and generating growth. For all of us who could not make it to the Show, FMI has released the presentation decks that were used. There are lot of good presentation on Retail Technology, few good presentations on how to reduce shrinkage, Data Security, Category Management among others. Something that will keep you occupied for few days atleast.
- Emergency Preparedness Update
- Organized Retail Crime — Issues and Opportunities
- Winning the War on Shrink
- Anti-Theft Technology and Fixture Updates
- Energize Your Bottom Line
- How Do Retailers and Manufacturers Win With High Gas Prices?
- Impact of the Changing Senior Market on Retailers
- Let’s Walk the Store With a New Perspective
- Succession Planning for Success
- Sustainability in Action
- What’s New in New Products
- How to Market Fresh Foods to Moms and Children
- Latin America: Evolving Formats — Changing Consumers (Presented in Spanish only)
- Next Generation of Category Management
- Pharmacy’s Connection to Health and Wellness
- Shopping for Health — The Growing Health and Wellness Market
- Understanding Local From a Consumer Perspective
- Understanding Multicultural Consumers
Research: How Consumers Actually Shop For Retail Products Across Channels
by Deepak Sharma on Wednesday, May 14, 2008
 From Forrester Research, How Consumers Actually Shop For Retail Products Across Channels.
While cross-channel shopping is expected to top $1 trillion by 2012, less is known about specific consumer behavior that drives customers across channels. In a recent Forrester consumer survey, we found that for considered purchases where shoppers research products first, more than half of consumers begin their research process online. Those consumers who begin their research process online are also more likely to ultimately purchase products through the online channel. Although consumers are actively cross-channel shopping for their considered purchases, retailers fail to create a seamless multichannel shopping experience. To meet the multichannel imperative, retailers should conduct frequent cross-channel reviews and competitive site assessments, educate customers with comprehensive product detail pages, and ensure that product promotions are consistent across channels.
Good Read.

By reading this TMCnet article, "The Grocery Game helps food shoppers save money", I got introduced to The Grocery Game, a website that claims to save you hundreds of dollars on grocery bill each month. Idea is simple, if you're ready to do a little stockpiling at home, just paying attention to the discount cycles at the major chain supermarkets, can allow you to buy nearly all your food and other household necessities at near-wholesale prices. Match that with manufacturers' coupons and weekly specials, you can save even more than bulk discounters like Sam's club or Costco.
The Grocery Game takes help of "high-low" pricing strategy followed by most chain supermarkets.
In those stores, most items are not on sale at any given time, and on average will be more expensive than at stores like WinCo and Wal-Mart that follow the "Every Day Low Prices" approach, which relies less on short-term discounting, three industry consultants said.
But to lure shoppers into the store, high-low supermarkets always have some items on sale -- and the sale prices generally dip below what's available at the discounters, according to Gault and the industry consultants....
High-low pricing was pioneered by department stores in the early 20th century and has been standard in the supermarket business since the 1950s. The quarterly cycles have taken root in the business patterns of both retailers and manufacturers, Lilien said, with managers relying on discounts to meet their quarterly sales volume targets.
Newspaper advertising has been central to the high-low strategy since its inception. While supermarkets now list their discounted items on their Web sites and e-mail coupons to customers, the schedule of the weekly newspaper insert still determines when displays are rearranged and sales begin and end, said Bob Reynolds, a Moraga retail economist and consultant.
"In the culture of the business, even in this day and age, it is that print ad," he said.
The Grocery Store has built a nice payment structure around their service,
For a dollar, first-time members can try Teri's List for four weeks! After that, it's is just $10 every eight weeks for one store. Most areas offer only one store list. But if you happen to be in an area where more than one list is available, for each additional store list you choose, you'll be billed an extra $5 every eight weeks.
Little bit of Retail Insider knowledge can take you a long way. Stay tuned :)
The Times of India has an interesting discussion with Paco Underhill, Retail Anthropologist where he talks about how men and women behave while shopping.
"For a man, ignoring the price tag is almost a measure of his virility." Or, "When two women shop together, they talk, advise, suggest and consult...hence the long time in the store..." But when she's shopping with a man, "he makes it plain that he's bored and antsy and likely at any moment to go off and sit in the car...or stand outside and watch girls."
He also talks about Indian Retail Industry.
The Indian retail market, valued at $300 billion, poses its own unique challenges. Organised retail comprises only 3% of this market. But Paco believes we are more than ready for it, "If you can be the largest manufacturer of steel, buy Jag, put satellites into orbit, you can spruce up distribution networks and lower the cost of getting goods to market..." Indian consumers know they deserve better — a better product at a better price.
As for the dominance of mom-and-pop (kirana) stores, he believes that "some amount of trauma" as they reinvent themselves, "is natural". "Rebirth is healthy", he says, foreseeing a transformation in less than 5 years. But the country needn't look at Europe and North America as models of a retail boom. India shouldn't borrow, but invent. "Look at emerging markets like Brazil and Dubai for retail ideas".

